Powell River Action Centre Food Bank Statistics Jan 1 – Dec 31 2023*
How many people use this food bank?
| Individuals | 1,034 |
| Households | 682 |
| Total visits | 3,459 |
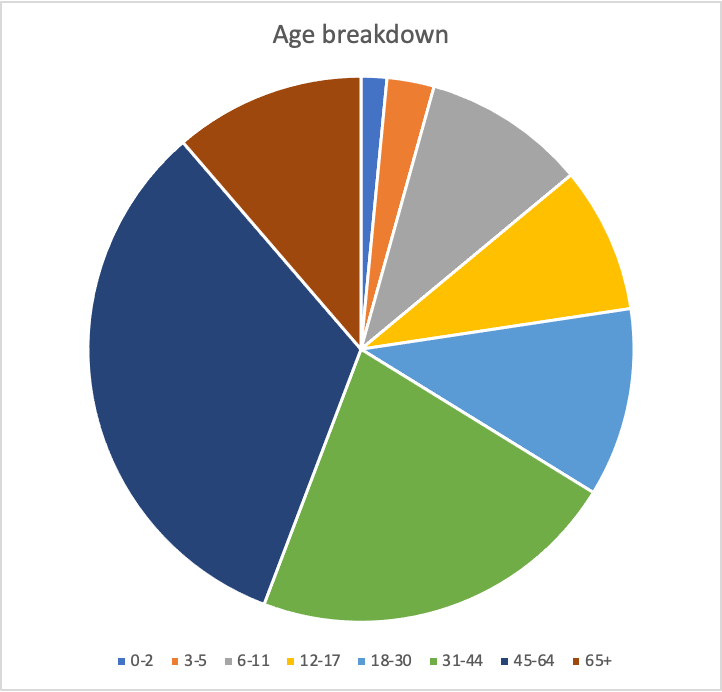
| Total Children | 234 |
| Total Adults | 800 |
The average number of household visits per year is 4.
| Foodbank visits in 2023 per household | Households |
|---|---|
| once | 144 |
| twice | 81 |
| 3 times | 66 |
| 4 times | 52 |
| 5 times | 48 |
| 6 times | 37 |
| 7 times | 24 |
| 8 times | 20 |
| 9 times | 24 |
| 10 times | 20 |
| 11 times | 21 |
| every month | 4 |
* local statistics reported using Link2Feed software
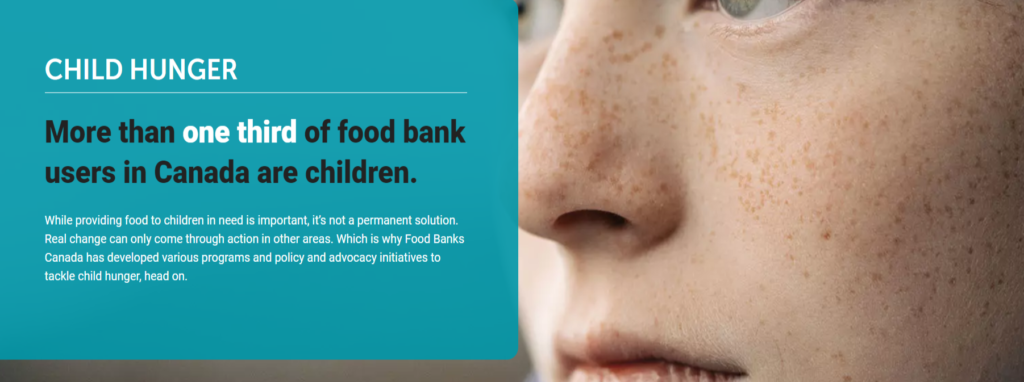
Read about Hunger in Canada